Reposted with permission from our partner Sentinel Fertigation
Incredible amounts of data are captured through agricultural operations each growing season. In 2017, Ohio State University master’s student Trey Colley and his advisor Dr. John Fulton collected 18.5 GB of data on a single corn plant. If I recall correctly, other presentations from Dr. Fulton have indicated that the amount of data they’ve captured over an entire field for a single growing season is in the tens of TB range. This data includes machine operations data, imagery, weather data, soil property data, and more. While not all this data is useful, some certainly is, and it would be beneficial to leverage it for improving crop production practices. Enhancing nitrogen use efficiency is one potentially beneficial use of agricultural data. Two primary classes of data-driven nitrogen management tools have emerged to leverage agricultural data for improved nitrogen fertilizer efficiency: models and sensors. In this post I will briefly discuss how each type of tool works, provide examples of each type of tool, and offer some advantages and disadvantages of each type of tool.
MODELS
As I discussed in my blog post on January 13, 2022, the agricultural nitrogen cycle is incredibly complex. Nitrogen models seek to capture this complexity using equations to describe the processes by which nitrogen enters, exits, and becomes plant available in the soil. Many of these processes are dependent on temperature, moisture, precipitation, soil properties, and other environmental and weather factors. To account for these factors, nitrogen models often incorporate soil property maps, historical weather data, and potentially historical crop production data to predict nitrogen fertilizer needs for the growing season. Within the season, nitrogen models may update this prediction based on collected weather data that indicates soil nitrogen availability or crop nitrogen need has deviated from what was predicted. Popular examples of model-based nitrogen management tools are Granular Agronomy + N Services and Adapt-N. The biggest advantage of nitrogen models is that they are inherently predictive, helping farmers and their trusted advisors stay ahead of crop nitrogen needs. Because they are based on equations, they scale easily geographically. Additionally, they generally allow users of the model to vary parameters (e.g. application rate, product, etc.) and estimate what the system’s response might be with those changes. There are a few disadvantages to nitrogen models. Because they rely on weather data to make in-season adjustments, it is important that that weather data is accurate for the field on which the model is used for the adjustments to be accurate. To date, most model-based solutions have not included real-time feedback of crop nitrogen status or soil nitrogen availability to confirm accuracy of the model on each field. Additionally, because models rely on equations and need to encompass all processes related to nitrogen availability and uptake, they are prone to errors arising from inaccurate parameters, unincorporated management practices, and unique field conditions.
SENSORS
Sensor use for nitrogen management follows the paradigm that the plant aggregates all factors and processes that affect soil nitrogen availability and crop nitrogen uptake. Essentially, sensors rely on the fact that photosynthesis is related to crop nitrogen status to quantify the plant’s nitrogen need. Sensors assess nitrogen status of a plant by measuring the intensity of light reflectance off the crop canopy in specific wavelength ranges. When plants are healthy and photosynthesizing at a high rate, they absorb a lot of light in the wavelength range corresponding to red (R) light and reflect a lot of light in the near infrared (NIR) wavelength range. Reflectance in the NIR wavelength range is related to leaf structure, and healthy leaves reflect significantly in the NIR wavelength range. Alternatively, when plants are photosynthesizing at lower rates, they absorb less light in the R wavelength range meaning that more R light is reflected. If this lower photosynthetic rate is accompanied by degradation of leaf structure, NIR reflectance may be affected as well. Vegetation indices (VI) capture and quantify changes in crop canopy reflectance and are correlated with crop nitrogen status.

Figure 1 – NDVI visualized with physical phenomenon. See reference 2 for image source.
Normalized difference vegetation index (NDVI) is one index that has traditionally been used to assess biomass health and correlated with crop nitrogen status. NDVI is calculated as (NIR – R)/(NIR + R), where NIR and R indicate the reflectance intensity in the NIR and R wavelength ranges, respectively. Basically, when a lot of R light is absorbed – there is low R reflectance – the NDVI is high. When a lot of R light is reflected – there is low R light absorption and therefore low photosynthesis – the NDVI is low. NDVI has shown correlation with crop N need and is used in some sensor-based nitrogen management tools. However, it tends to be less effective when crops reach more mature vegetative stages, particularly corn. The normalized difference red-edge vegetation index (NDRE) offers an improvement over NDVI for corn and other crops at more mature vegetative and reproductive stages. NDRE follows a similar formula to NDVI – (NIR – RE)/(NIR + RE) – but uses the red-edge (RE) wavelength range instead of the R wavelength range. The RE wavelength range lies between the center of the R wavelength range and the NIR wavelength range; it is basically on the edge of the crop absorption wavelength range for R light. Because it sits on this edge, it is highly sensitive to changes in crop R light absorption and allows for greater detection of photosynthetic rate and crop N status. NDRE has emerged as a preferred index for use in nitrogen management, particularly in corn. With all the scientific stuff out of the way, the next two sections will briefly discuss two types of sensors that make use of crop canopy reflectance for quantifying crop nitrogen status. Generally speaking, sensors have the advantage of quantifying in real-time the nitrogen needs of a specific crop in a specific field at high spatial resolution without detailed knowledge of every process affecting crop nitrogen uptake and soil nitrogen availability. Additionally, crop nitrogen status may be quantified throughout the season. Downsides to MOST sensor-based nitrogen management tools is that they require the crop to express nitrogen deficiency before action is taken, potentially resulting in lost yield potential from crop stress, and they fail to adequately ensure that changes in photosynthesis are due to nitrogen stress and not some other stressor.
PROXIMAL SENSORS
Proximal sensors measure crop canopy reflectance from a position close to the crop canopy. Examples of systems that use this technique include the OptRx system produced by Ag Leader and the GreenSeeker system produced by Trimble. These systems involve sensors mounted on a high-clearance applicator boom that take point measurements of NDRE and NDVI, respectively, and use algorithms to convert the VI value into a target nitrogen application rate for the applicator. These systems offer the advantages of high resolution and minimized environmental condition interference with reflectance measurements. However, users are unable to review the recommendations of the system prior to executing the application. Because these systems are almost always used on ground rigs, the application window is still limited meaning that corrective applications to account for changes in crop N status can’t be made during late vegetative and reproductive growth stages. When fertigation is used, this limitation disappears.
REMOTE SENSORS (IMAGERY)
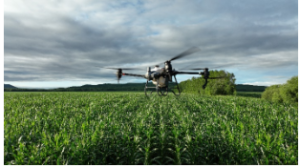
I’ve taken the liberty of considering remote sensing data used for nitrogen management to mean imagery. While there are some exceptions, this is broadly true and will help simplify the discussion. Imagery of the crop canopy captured via UAV, manned aircraft, or satellite measures light reflectance and allows computation of VIs for the whole field at one time. Imagery is high throughput and scalable, though still very precise allowing for high-resolution assessment of crop nitrogen status throughout the field. Additionally, because imagery may be reviewed prior to application execution, farmers and trusted agronomic advisors may make any changes to image-based recommendations prior to those recommendations being implemented. Because imagery relies on ambient light conditions and can involve stitching individual images into a single image of the field, the primary downside of imagery is that data quality can be affected by the time of day, clouds, and wind. Accounting for these factors using proper camera calibration techniques and ground-control schemes is critical to success with image-based nitrogen management techniques. Image-based nitrogen management tools are starting to emerge as imagery captured from UAV, manned aircraft, and satellite platforms becomes more available. Imagery unlocks many doors for farmers in non-irrigated systems making sidedress applications as well as for farmers who fertigate throughout the growing season.

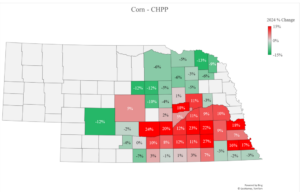
Figure 2 – Example NDRE imagery captured of a cornfield in central Nebraska.
SUMMARY
You may have heard the saying, “All models are wrong, some models are useful,” commonly attributed to George Box. You may also have heard the saying, “Garbage in, garbage out,” referring to insights derived from low quality data. These sayings can be applied to models and sensors, respectively. In an ideal world, models and sensors would be integrated to complement each other’s strengths and balance each other’s weaknesses. Integrating the two is challenging, though, and has not yet been done successfully. Models are useful for getting a sense of how much nitrogen fertilizer may be required over the course of the growing season when developing a fertilizer management plan prior to planting. When it comes to in-season nitrogen management, though, it is my opinion that sensors – particularly imagery – are currently the best option due to their real-time quantification of crop nitrogen need based on field-specific, high-resolution data from the crop canopy. Appropriate use of sensor data requires proper calibration, clever data quality insurance procedures, and optimal timing to achieve successful outcomes. Most sensor-based solutions do not ensure that these requirements are met, but Sentinel Fertigation’s solution does. In next week’s blog post, I will breakdown Sentinel Fertigation’s sensor-based fertigation management framework and discuss what differentiates it from other image-based nitrogen management solutions on the market. Stay tuned and let me know your thoughts!
REFERENCES
1 – https://www.osu.edu/features/2018/an-ear-for-the-record-book.html
If you’d like to learn more about this new method of nitrogen management, give us a call at 402-843-5342.