Hello to everyone at Midplains Ag and beyond. It’s a pleasure to be here again. Now that we’ve gone through the bulk of the summer, especially the bulk of the corn growing season, we have a pretty good idea of what is forthcoming. So unfortunately, the market outlook is still fairly negative, at least for the medium term. Let’s call that the next four or five months. The outlook seems to be bullish, usually takes something different.
These balance sheets, one way or another, have to change significantly. You need to see lower stocks in the US, worldwide, larger energy consumption and just needs to run the gamut. So the medium term outlook, let’s call this into December’s expiration. It is still oversupplied. Previously during the summer, there was some optimism surrounding yield loss in wheat, in Russia and Ukraine, corn yield loss in Ukraine. But now the new data, including vegetation maps, actual reported yields in the Black Sea, suggests this is unlikely.
In fact, the Black Sea wheat crop could be a lot higher than expected in above the USDA’s forecast. Of course, in the US, we’re looking at potentially record large US corn and soybean yields following an improvement in rainfall in the month of July. More importantly, probably the cooling of temps over the last several weeks, that have continued on really into this week. Corn, especially, it’s very, very timely.
So beyond harvest or really beyond, probably September [inaudible 00:01:40], the market will ship its focus to demand. Major importers, we found, did embark in some kind of restocking effort of corn and wheat. During the peak of COVID-19, they’re concerned over food supply, but now new financing difficulties, economic weakness, is weighing on current and future grain importing.
Travel is key. We’ll get into this in just a bit, but many major grain importers rely heavily upon tourism for foreign exchange. Countries like Morocco, Turkey, Egypt. As we’re debating how this economic recovery develops, at what point does energy consumption normalize, we know that international travel is still a ways off. How does that impact the purchasing power of these large grain imports?
When do energy markets normalize? Is it still dependent on a COVID vaccine? The most recent data, up to the end of last week, indicates that consumption of crude petroleum, gasoline, ethanol is still plateaued at levels substantially below last year. OPEC also started to produce just a little bit more oil beginning over the last weekend. So we’ve got weak demand growth in energy and increasing production.
So the outline we think for the next five or six months is first, we need to digest US crop size. Whether that’s substantially above USDA forecast or if it’s at or below, we just need to know what it is before we think the market bottom. At that point, we can determine the chore of demand that is needed in the first and second quarters of the crop year. Then we shift focus to South American seedings and weather, beginning of November.
But the first two steps of this do look to be negative, barring some catastrophe, harvest, a hurricane, early frost, something like that.
So longterm, what is needed to be bullish of the agricultural markets? To us, it’s a further collapse of US dollar or Chinese corn demand of 10 to 12 million tons annually. So far, they’ve bought almost four million tons from the US. There’s talk that this could be higher. Maybe there is some kind of real supply tightness in China. We don’t know. We tend to think maybe not, but either way, we do need to see China import much more than that projected seven million tons of all origins to really shift the corn market outlook in the next 12 months.
So we’ll get right into it. Yield probabilities. So we’ve done a lot of work on analyzing, digesting other firm’s ability to forecast the yield, or just how accurate have these monthly estimates been. What we found is that our own crop condition yield model since 2012 has performed the best. That is not to toot our own horn. We just wanted to identify what model works the best. That’s the one we’ll follow, no matter whose it is.
This is not terribly complicated. This is basically just the year over year change in crop ratings, good to excellent. In a year over year change in mass yields. So anyone can make this model. Secret is out. So we’ve seen that last year, it overestimated yields into September, but then it was very, very accurate. So the point is, as of now, as of crop ratings in early August, the most probable yield in the August crop report is between a 180 and 181. So that is a one and a half, two and a half bushels from the USDA current.
The soybean yield model’s a little more impressive. Last year, it overestimated yields into November, but then in the end, it was fairly accurate. That make sense, just given that your crop ratings in June are not nearly as important as crop ratings towards the end of the growing season.
But this yield model, as of now, suggests a US national soybean yield of 52 bushels an acre, and that is up almost three bushels above the USDA sport care. So both are higher. The soybean yield on a percentage basis is a little more significant, should it come to fruition. So what that looks like historically, we’re looking at a 15.2 billion bushel corn crop in the US. That is up roughly 200 million from USDA and up 1.5 billion on last year. So that hole, there needs to be demand that fills that. That’s what the market will start to focus on, and really beyond the early part of September.
Soybean is a crop of 4.3 billion bushels. It’s up 200 million from the USDA and up 3.6, I’m sorry, up 700 million from last year or about 19%. So we’re looking at a major, major change in US soybean production potential, barring again a catastrophe at harvest.
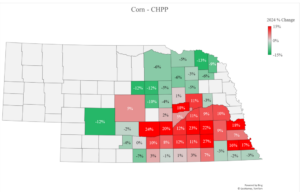
We also look at where these changes in production have the most impact on cash markets. So really outside of maybe Colorado and Ohio, all states are doing better than they are last year and on average. But we’ll look at something like Iowa and Nebraska. Just did the points of good excellence. You have two and 3%. So a crop near last year, mostly … I’m sorry, last year average, most like the trend yield, slightly below trend yield.
But if you move on down the line and look at states like Kentucky, Alabama, who, as of last week, its corn crop was 90% good to excellent. The crop in South Dakota is 18 percentage points higher than average in terms of good to excellent. So we had this regional corn supply tightness in the Eastern Midwest, Kentucky, Illinois, Ohio specifically. Their base is still today is positive and peaked at about 30 to 40 cents over. But we think that is where the base has had the most dramatic change, moving forward.
New crop goods just seem to have started to normalize 10, 20 cents under, and that’s going to be the biggest change for cashflow for the farmers, is going to be in that part of the world near the eastern corn belt. South Dakota, unfortunately, is going to have a massive surplus with very few new markets available.
More or less the same in soybeans. Year over year on the margin, gains in Western and West should be fairly limited. When we look at the Eastern Midwest and mid-South and Delta, especially, major, major changes in yield compared to last year. Now, Louisiana is up 23 points from average. South Dakota is up 22 points from average. So ballooning surpluses in those parts of the country, and especially something like Louisiana and Alabama and Mississippi. Their proximity to the Gulf will fill that early season export demand. So the demand pool further into the Midwest and into the Plains will be probably a little slower to materialize, unless we see just massive weekly demand from China.
The other big issue is these issues are probably away from the US. But what we saw was some severe heat in Southern Russia and very concerning for wheat production there. It ended up being a fairly normal year and a very good year outside of Southern Russia, but this highlights what turned to be brief, but real market concern for cash wheat prices. Once the Russian wheat harvest started, we were looking at a cumulative yield, 15, 12% below last year. If you were to extrapolate that at 10% harvest, that would suggest that maybe the USDA’s Russian wheat production number was 10 or 12 million tons too high.
All of a sudden, carrying that forward, Russia banned wheat exports. This is a major problem. But in the subsequent weeks and very counter-seasonally, Russian wheat yields have rallied quickly every single week. So now at 44% harvested, wheat yields are above last year and still rising. So we think that this probably continues and the discrepancy between recent years and this year gets wider. So very quickly, in a matter of three weeks, now we’re looking at a Russian wheat crop of perhaps 80 million tons. Then that’s 3 million times above the USDA’s forecast.
Russia, in that three week period, has gone from needing to slow export demand to needing to find more export. That’s what’s really weighed on wheat in the last 10 sessions. Then at the same time that we’re seeing Russian wheat yields increase, we’re looking at a very, very good weather forecast in Australia. This was all mostly expected. That is because of the development of La Niña.
La Niña doesn’t correlate with weather everywhere, but where it does, is in Argentina, Australia and Southeast Asia. La Niña is typically very, very good for rainfall in Australia. This is the two week forecast. Major wheat and barley production areas are highlighted. In some pockets of these grain-producing areas, more rain will fall in the next 10 days then what usually falls through the entire month of August.
Because of La Niña, the climate forecast also keeps this pattern of normal to above normal rainfall intact into the end of September. So places in Eastern Australia, especially, you can see a record or near record wheat and barley yields. This is very, very different because Australia has had three years of drought, two years of severe drought consecutively, beginning in 2017. In the last two years, Australian wheat exporters have been more or less completely absent from the global market. It was really left to Argentina and the Northern hemisphere to fill importer wheat demand.
That changes significantly this year. The Australian wheat harvest starts in November. Exports will be available by December or early January, and they are already looking to compete and give competition to Europe, the US, and Russia. That is not something that have seen in the last two crop years. So again, this is also what’s weighing on the wheat market.
To put this into perspective, we think the USDA’s forecast because of recent and upcoming rainfall and the climate forecast, is too low. So we think that Australia will have a combined wheat and barley harvest. The 40 million turns that’s up four million tons from last year and 16 million tons from 2019. Australian domestic grain consumption is very, very flat at about 14 or 15 million tons. So all this will find the export market, and it will find the export market through price.
We’re already looking at very, very steep discounts in Australian wheat futures in January, onwards. In fact, as of this week, Australian wheat futures for January are below black seed cash prices. So there’s going to be a lot of competition for wheat demand. This is not really pertaining to the Nebraska farmer, but if we’re not looking at a shortage of wheat, there’s little else left to hold up corn, in the context of record US yield control. So this is important to all grade markets.
So as we start to think about rising supplies in the US, rising supplies outside of the US, competition for world share, et cetera, this is something we’ve seen for the last several years, but there is a larger burden now being placed on world grain consumption growth if we are to avoid ballooning surpluses worldwide, and especially in major export wheats.
COVID, which is still around, and of course has changed everything negatively on margin. I think we’re all aware of the US case and death numbers. So we won’t get into that, but we do want to highlight two countries, India and Mexico. India, because of its contribution to GDP growth. It’s one of the last countries that still prior to this year, have seen growth of 6% or higher GDP year over year. In 2020, this will fall just 1%, and the return of growth thereafter really hinges upon the rate of new infections. This graphic getting very close to zero. Of course, we all know it’s a very densely populated country, infrastructure is poor. So this could be very, very difficult.
In Mexico, because of the sheer size of its corn, wheat, soy and dairy imports from the US. So the largest buyer of US corn to sizable destination soybeans, wheat, and even fluid milk. It’s only one of the few places we shipped fluid milk. So this curve also needs to get a very, very flat Mexican food demand is to grow on the margin. Like I mentioned before, a lot of this centers on travel, which at the moment, is very, very weak.
So as these countries experience higher unemployment, weak year over year growth in total revenue, we know that consumers are going to spend less. This shows that graphic empirically, but this is not surprising to anyone. The correlation between unemployment and consumer spending is very, very tight. So these are places that experienced swelling unemployment. India’s urban unemployment today is 10%, Mexico’s national unemployment is 12%, and in the US, 30 million people or so are unemployed. We know that consumer spending is going to be down.
How does this impact international travel? Well, of course it does. We all know that, but we wanted to provide some context to know exactly what that means. So world bank data is good through 2018. I don’t imagine 2019 was much different. In fact, there probably was growth. But it was just interesting to think about the Mexican tourism revenue in 2018 was $24 billion. It has been growing and was not even hit all that much during the financial crisis of 2008, 2009.
But because of mandated travel restrictions, this is going to be a much, much weaker number in 2020. So that money that could be used for food at resorts, government taxes, we just think purchasing power in these places is going to be down year over year.
Egypt as of 2018, $13 billion of revenue due to international tourism. Higher than expected. This, too, will be closer to four or five million, probably in 2020, if that. So we’re already seeing Egypt scramble for cash in order to buy wheat. They bought very strange tonnages and really, they just buy week whenever loans come through from international banks. So this is different. We have not seen something like this. What interests me about this is the Egyptian tourism revenue was growing during the financial crisis of 2008, 2009. Only really when the Arab spring started, did that get affected, but they were just beginning to recover when COVID-19 hit.
So, of course, all this is going to have a major impact on GDP growth. We’ve seen charts like this, and they’ve been updated since, but negative GDP growth in North Africa, the Middle East, and really everywhere. But these places that are still relying upon tourism and foreign exchange, especially, are also very big importers of corn. It shows the international tourism’s contribution to exports. So a major component of GDP.
So Egypt, 25% of exports. Turkey, 15% of exports. Turkey is one of the larger importers of weeks to make flour. US tourism, international tourism, contributes just 10% to exports. So it was a much smaller portion of GDP relative to these other countries. So prior to the outbreak of COVID-19, we were forecasting record corn imports from North Africa. 22 million tons. This compared to just 11 million tons in 2012.
The same thing for wheat. Record imports. 29 million tons. But how does this become effective if those countries’ GDP growth is negative, foreign exchange is down and government revenue is down? We’ve already seen this take effect.
World wheat trade in July will be a four year low at 10 million tons down from the last two years, especially. While annual wheat trade was growing, this seems to have caused a major snag in the growth of wheat consumption worldwide. Remember, this is happening at a time that production is growing in Russia and Australia, even Canada, and probably the US, to some extent.
So it’s this lack of trade that’s going to make balance sheets look even more negative as they’re compiled in the next two to three months. Corn trade, too. We’ve seen really corn trade struggle prior to COVID-19 and it bounced a little bit in June, relative to the previous year. But cumulative major export corn shipments as of June are unchanged on the previous year at 115 million tons. So if we can’t find growth in a non-COVID year, we don’t think we’re going to find growth in the 2020 and 2021 crop years.
In the case of soybeans, we have seen incredible demand growth in China. They seem to be doing much better economically. They were very quick to shut down the coronavirus. We’re also seeing what’s a good evidence that their pig herd is beginning to expand again. I think we’ve discussed previously that those pigs now will enter commercial production. It’s going to be much more efficient, but also require commercial feeding rations.
So that’s going to demand a lot more corn and soy meal and a lot of wheat ingredients as a whole. But still we haven’t benefited all that much. China seems to be buying what China needs from the US to prevent new tariffs from coming on. Where I look at the red line on graph, Brazil has benefited immensely from the return of China’s hog herd growth and economic resiliency, at least. So we wonder if there is a point, not going to be this year, but 2021 or ’22, when Brazil possibly can supply China’s soybean import needs entire.
This is why Chinese and US relationship is so important. Phase one deal aside, we would like to have the benefit of capturing China’s growing need. Speaking of politics, this is partially due to, I think, our infatuation with terrace and the beginning of the trade war, but it’s also a longterm trend. But the US on a monthly basis has more often been a net importer of ag products, which is unfortunate.
Prior to 2019, it was nearly unheard of. Ag’s contribution to GDP was fairly sizable, but that does seem to have changed over the last 16 months. So using census data, there have been four consecutive months where the US has been a net importer of agricultural products on a value basis.
So again, rising supplies, weak structural demand growth in grains and energy markets don’t look all that much better. So this is entirely related to COVID, which triggered unemployment, mandates on travel, but we noticed gasoline consumption recovered quickly in late spring. But since June, really has plateaued. We see no reason why this plateau is exceeded in the next two months. We wonder if it is not exceeded into the early part of 2021. So this is the deal, between seven and 10% below last year, and that probably continues into December.
Ethanol production, because of its mandate as a fuel additive, is just going to follow weekly gasolines. It’s also plateaued, and also notice that it’s fallen short in all but one week of what’s needed to meet the USDA’s forecast. So because of this plateau in energy consumption, we think the USDA’s old crop corn industrial use forecast is still overstated by 10 to 30 million bushels. So that will come in either the August or the September Wiseman Report.
So while we’ve got plateauing US and world energy demands, OPEC is starting to produce more. After August, this will be more fluid, but the EIA’s short term outlook based on OPEC’s plan to increase production, suggests that this will be an uptrend that carries into the first part of 2021. So already, there is a historic cut of 10 million barrels per day during the spring. By August 1st, that cut was lowered to just eight million barrels per day. We get back to more or less pre-COVID levels by December.
So this, like the grains, mandates we find energy consumption growth to prevent a swelling of stocks and cheaper prices. But we do think that OPEC does continue to produce more crude. Again, it goes back to government revenue, foreign exchange. They just can’t afford not to at this point. So the energy outlook is very slightly bearish, but still bearish. That’s not terribly insightful. That’s what happens every year. Crude gasoline, all petroleum demand peaks in June or July, as does price. Then we get a weak, neutral trend and very slowly drifting lower into the end of the year.
So that trend should be followed, but we’re starting at $43 crude, that means that we could see $36, $38 crude in the next 90 days. We could start to drive more miles in the US. Maybe this changes, maybe OPEC does keep this production cut of eight million barrels per day, intact through the end of the year. But what this does to the corn farmer, is it gives us a way to define the ethanol economy. So we can even boost ethanol production in the remainder of 2020 and early 2021. But at what price does corn have to be to provide this incentive? That’s the big concern for us overall.
Currently, futures-based ethanol production margins turn negative when Spot Chicago corn is about $3.40 a bushel. So that reflects to us a hard cap on rallies, should they occur in the next couple of months.
In exports, we’re seeing more and more reliance on China. This relationship is very, very important. It does seem to be political for the moment, but we would like to keep this relationship positive and intact. So we can see this new crop corn export commitments as of late July. They’re a solid 325 million bushels. That’s up substantially from last year’s 150 million bushels. But notice that real demand growth is due to China.
We think that China might be done buying corn, especially from the US, so at least to the end of calendar year 2020. Perhaps they come back in early to mid-2021. But that, too, probably depends on South American production and the US’s trading relationship with China at that point. So Chinese demand is very, very important. Non-Chinese demand is pretty ho hum at the moment.
It’s less of an issue for soybeans. We always sell a lot of beans to China, but we can also see pretty uneventful demand to the rest of the world. A lot of this demand growth your year, which is sizable. New crops, soybean exports, as of now, are five times what they were last year, but that’s due to China. So we can’t source all of the beans from South America just yet. So we’re going to see more sales to China on a weekly, near daily basis, probably for the next several weeks.
But what does China absolutely need from the US to bridge the supply gap? That’s what we think they’re going to buy. They’re going to fall short of the phase one agreement. There’s really no doubt about that. The intention seemed to be worsening and USTR will host a meeting with China to discuss the progress of phase one on August 15th. We’re just a little less optimistic, or it’s just really comes down to this relationship with China if we are to meet the USDA’s new crop soybean export demand forecast, because otherwise there’s really not a lot of reason or incentive for the importer to book heavily forward US corn.
Argentine basis has followed the US higher, but still about 20 cents cheaper to buy corn from Argentina than the US goal between now and October. So into a harvest position, even in the US, Argentine corn is still more attractive to the importer, especially given Argentina has a very slight freight advantage entities in Southeast Asia.
What are we left with, given all that? Weak energy demand growth, terrible cash reserves in major importer countries, record US yield potential. This is the balance sheet, as we see it now. So not wildly different than the USDA’s, but still looser to some extent. The 2.98 billion bushels this year, and assuming we cut three million acres for production next year, cheap prices and assume trend yield of 181, we’re still left with 2.7 billion bushels next year.
So like we’ve done in all of these webinars, we really do want to push the farmer to sell forward. Capture those premiums and make sure the insurance products chosen are correct. That we get paid and corn goes down. There’s otherwise no real silver bullet to this. This is going to be a lasting period of over supply.
In the case of soybeans, not wildly bearish by itself, but still more than adequate stocks. So we think that in the end, the USDA’s new crop soybean and stocks will be up a little over 200 million bushels, mostly due to yield. Maybe a little bit due to a lack of demand growth. But then we’ll be adding to corn acres in 2021. So if we assume four million acres are shifted to soybeans, even assuming another year of demand growth, and about a hundred million bushels, we’re still left with 685 million bushels in stocks.
So this just keeps soybeans at an $8 to $9, $9.50 commodity. So we still have this mentality of selling rallies and everything. None of this goes away. Competition from South America, improving yield technology in these emerging markets, none of that changes in the next 24 months.
There’s a silver lining down the road or potentially one. So for the first time in three years, we are looking at the formation of La Niña, to some extent, probably fairly strong. Again, like I mentioned, this doesn’t drive weather in many places, but one of the places that it does, is Argentina. It is a net negative for Argentina. This shows soybean and corn yield’s performance against trend in Argentina in years that La Niña is present in December.
So clearly this is not a positive for Argentine rainfall and temperatures. So La Niña is forecast to be around in December. So could we lose 20 million tons of corn production in Argentina, like we did 2017? 15, 20 million tons of soybean production like we did in 2017. We don’t know. La Niña forecast could change. It could rain anyway, in the month of November and December, and we’ll be just fine in terms of world supply.
This is something that’s caught our attention and just means that maybe not get too aggressive selling December of ’21, corn below $3.40. It’s all we can say for the time being, but it’s something that we’ll be watching as we get through these steps of determining US crop size, determining the demand trend that’s ahead. But then when we get to watching South American weather, this will be a little more important, especially we are seeing dryness intact across Argentina currently.
This assumes the very nearby forecast and shows percent of normal rainfall in Argentina from July 1st to August 15th. The major corn soybean belt is highlighted and already, this is starting to trim acreage forecasts. People are very concerned about the lack of rain. In fact, the 30 day forecast isn’t much better. It’s very early. Even early corn planting doesn’t start until September, but there’s no doubt there needs to be an improvement in moisture if we are to realize new crop, Argentine corn and soybean production forecast. So this could beat least a modestly bullish shock to the market, come piece Feb of this winter.
So that’s what we’re left with. Unfortunately, the outlook is still negative, features oversupply, but there will still be opportunities presented. I thank you for joining. We’re here to help. If you have any questions or comments or rebuttals even, please email me at buckner@agresource.com. Thank you very much.
Q&A
What is AgResource anticipating the lows to come this fall? How low could that be?
I would trust a broad seasonal trends. It’s just been foolish to ignore those, and that would be the first half of September and probably down 7% from this week’s settlement, to be honest with you, how that works. So we assume basis spot. That’s probably something like $2.80, $2.85, December corn during the first half of September. Maybe in September, contract during expiration just plunges at $2.80, and that’s probably it. Then at that point, it’s probably not wise to be bearish corn. But without a South American weather issue, it just turned into a very neutral market. So we have this range of $2.80, $3.20 in the following six months. That’s our roadmap of corn, and soybeans is the same.
First half of September, maybe $8.40, $8.50 in a very neutral market into the early part of 2021.
So there’s nothing. Except for La Niña possibility in Argentina, there’s nothing really super positive out there.
There’s not. There’s not, especially what we’ve seen in the Russian wheat. La Niña doesn’t affect corn and beans specifically, but it does take some of the wind out of the raw material speculator. There’s just not a lot of reason to go long commodities at the moment. Yeah, I think it’s two things. It’s South American weather and it’s Chinese buying. So we’re a little pessimistic on Chinese man. But it’s just a very opaque market.
There is evidence that tents that Chinese corn market is fairly tight and they could import 12 million tons. We’ll have to follow that pretty closely, but those are the two things that would change the structure of the market from the way it stands today.